7. Application Metrics
7.1. Overview
This section provides guidelines on monitoing the nordmart application.
7.2. Guideline
7.2.1. Cluster Monitoring Prometheus
https://prometheus-k8s-openshift-monitoring.DOMAIN
1
To check memory utilization ratio of cluster nodes, write instance:node_memory_utilisation:ratio in search bar on the main page and Click Execute. Results will be shown below.
7.2.2. User Workload Monitoring Prometheus
Link:
https://workload-prometheus-stakater-workload-monitoring.DOMAIN
1
To check if prometheus target is up, check the URL given below
https://workload-prometheus-stakater-workload-monitoring.DOMAIN/targets
1
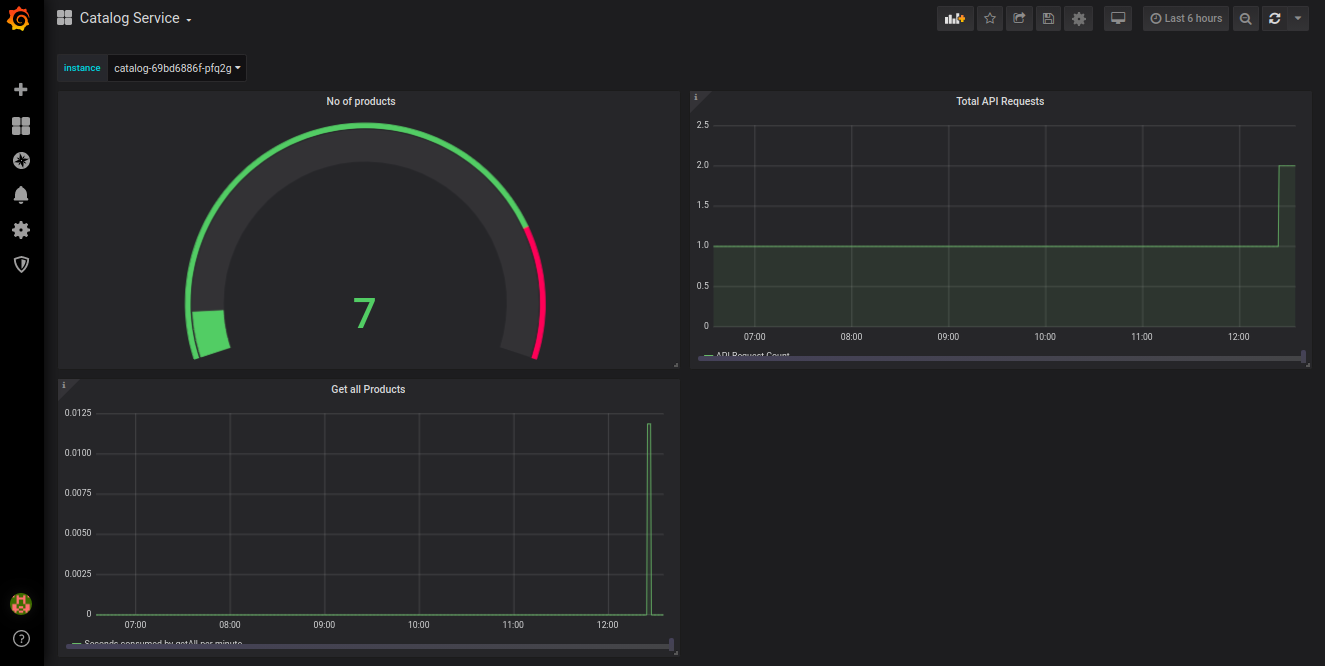
7.2.3. Link to Grafana dashboard
https://grafana-stakater-workload-monitoring.DOMAIN
1
To See the No of products available in the catalog, Click on the window icon on the top left corner and Select the item Catalog Service
Monitoring dashboard